One thing we hear over and over from advisors: keeping up with ETF due diligence is tough. The ETF industry is a beast, with five to twenty new funds entering the market every single week. For advisors, that pace can be overwhelming, especially when it comes to the actively managed ETF space. Here, different investment philosophies, strategies, and portfolio managers come into play, adding layers of complexity to the process.
Evaluating active ETFs is a whole different ball game compared to passive funds. With active management, you’re not just assessing costs or tracking a simple benchmark, you’re trying to figure out if the fund’s pursuit of alpha is worth the higher fees. And with all the various approaches out there, that decision isn’t always easy.
Growth and Adoption of Active ETFs
The growth of active ETFs continues to accelerate. By November 11th, 2024, active ETFs in North America reached a milestone of $900 billion in AUM, representing approximately 8.5% of total ETF assets, up from 2.8% in 2018. This growth isn’t just noteworthy; it’s a clear signal that investors are embracing active ETFs, particularly in North America, where active ETFs now represent a quarter of total ETF flows.
This momentum is backed by hard numbers. In 2023 alone, active ETFs accounted for over 60% of all new ETF launches and captured roughly 25% of total ETF flows in North America. Compare this to just five years ago, when active ETFs made up only 10% of flows (Trackinsight Global ETF Survey 2024). Investors are warming up to active ETFs, largely due to increased product diversity, better distribution channels, and an appetite for targeted, high-conviction strategies that go beyond passive indexing.
For those of us who’ve wondered for years whether active ETFs have “arrived,” it seems like they finally have—15 years after the first one launched.
Factors Fueling Active ETF Growth
So, what’s driving this momentum? For starters, regulatory changes have allowed for the development of more complex strategies and quicker access for investors. This regulatory shift has provided opportunities for active ETF innovation.
Then there’s the ongoing trend of converting mutual funds to ETFs. Demand from clients and distribution channels keeps this rolling along. And finally, investor appetite for high-conviction thematic plays, especially where active management adds real value, is stronger than ever. It’s safe to say the stars are aligned for active ETFs, and this growth trend is just getting started.
Tools and Methods for ETF Due Diligence
For advisors looking to do their due diligence on active ETFs, we’ve got you covered. Here are five steps to make the process easier and more effective:
Step 1: Classification Tool
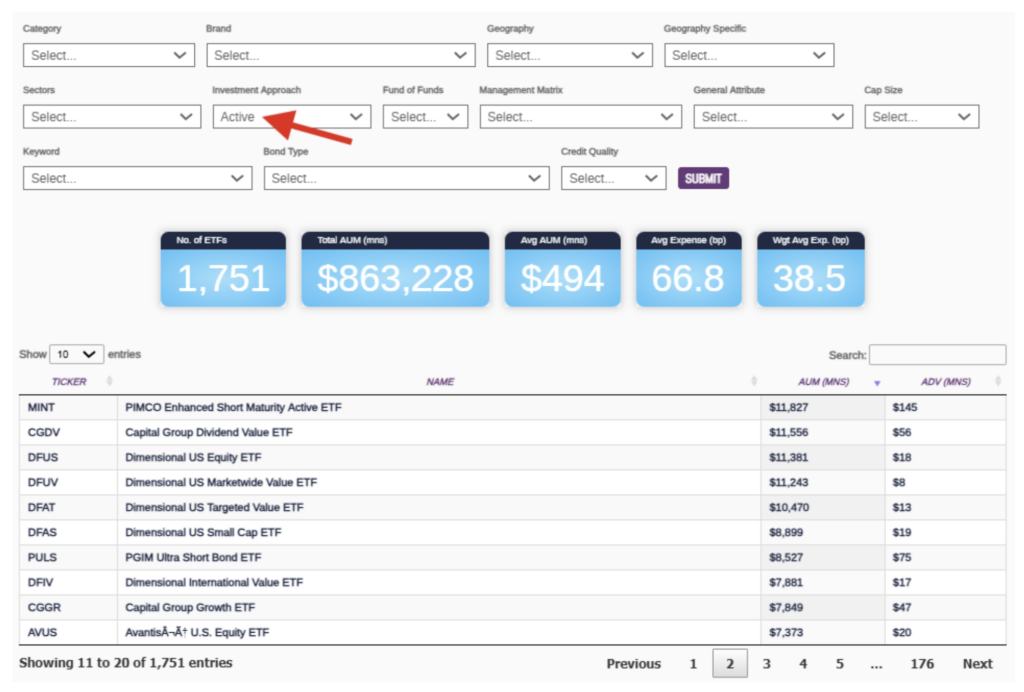
Start by finding the ticker in our Classification Tool (available on our site at https://etfthinktank.tidalfinancialgroup.com/etf-finder/). This screener lets you filter by investment approach, category, and costs. For active ETFs: you can instantly see how many active funds are in the market, what the average expenses look like, and where the money’s going (Data as of 11/08/24).

Step 2: Comparison Tool
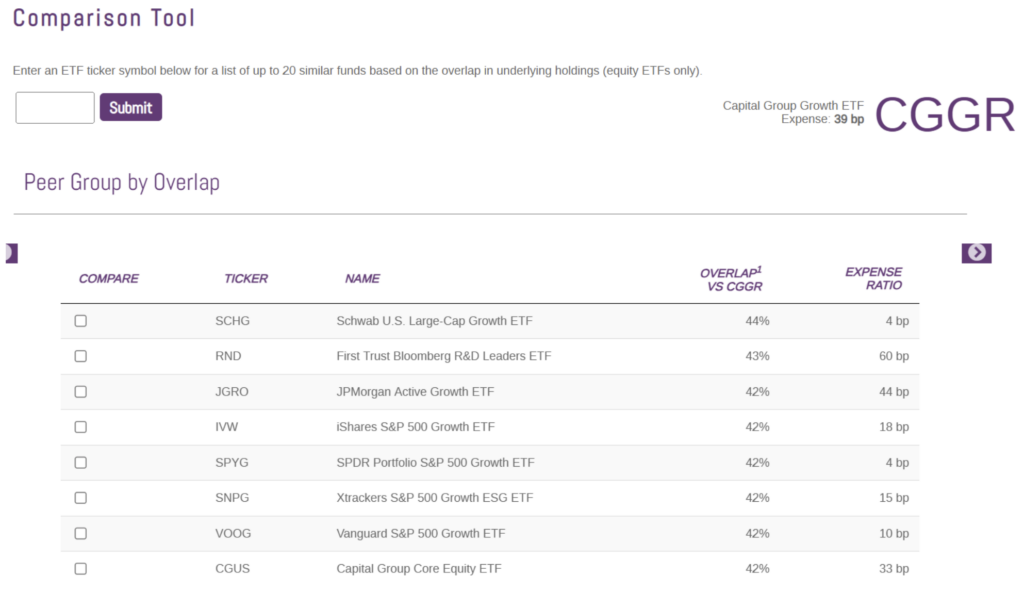
Once you’ve zeroed in on a ticker, dive into our Comparison Tool. This lets you see how much overlap exists between your fund and other ETFs in the same category. Take Capital Group Growth ETF, CGGR, for example.
This tool shows you that CGGR has 44% overlap with Charles Schwab Growth ETF, SCHG. But here’s the kicker: CGGR charges an expense ratio of 39 bps, which is almost 8x what SCHG costs. If cost is your priority, you’ll quickly get a sense of the fund’s value proposition relative to other options.

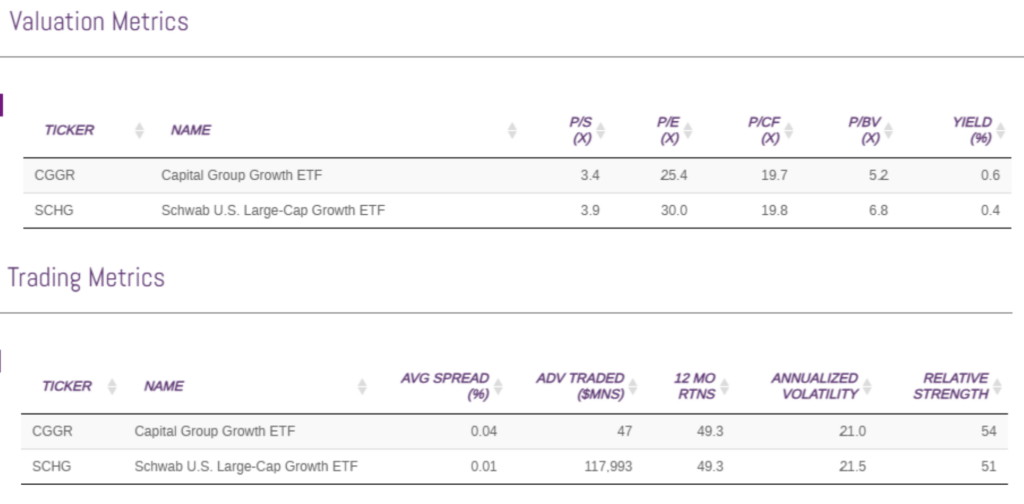
If you click on the “compare” boxes of a couple of funds in the list and hit one of the arrows on either side for a closer comparison, you will learn the fundamentals metrics and trading stats of each ETF (Data as of 11/08/24).

Step 3: Smart Cost Calculator
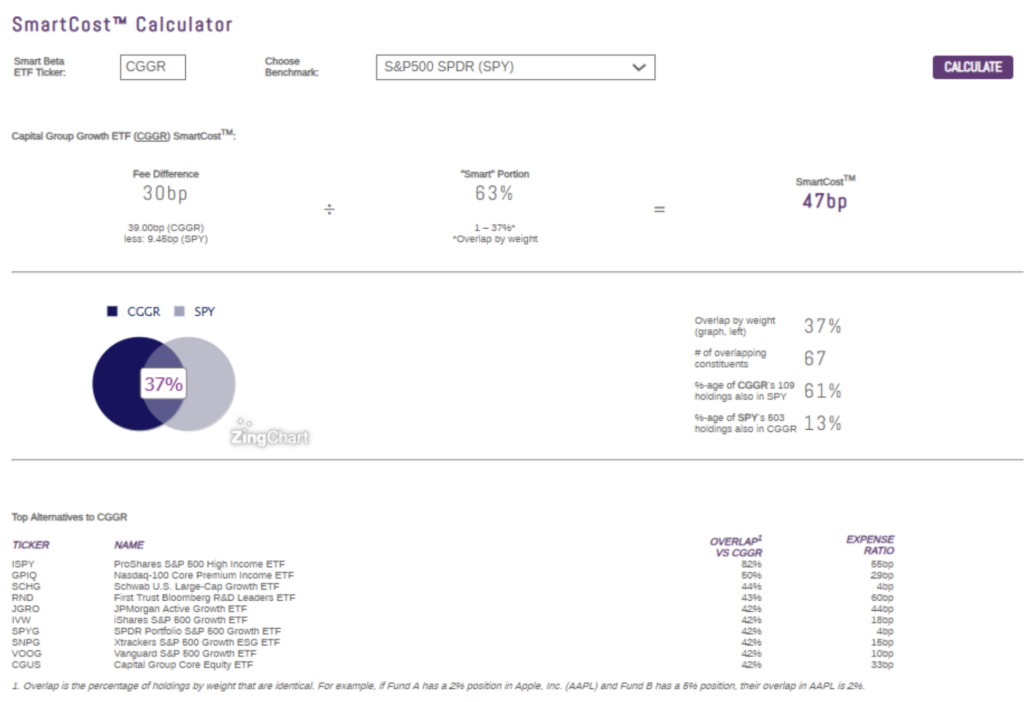
Cost is critical in any investment, but with active ETFs, you really want to know how much “active share” you’re getting for the fee. Our Smart Cost Calculator compares a ticker to a benchmark, letting you see how much of the portfolio is “smart,” or offering non-beta exposure.
With CGGR, for example, the calculator shows that about 63% of its portfolio is “smart”, offering plenty of non-beta like opportunity relative to the S&P 500, and you are paying 47bps for that. Ideally, your Smart Cost should match or beat the ETF’s total expense ratio, which means you’re getting your money’s worth.

Step 4: Concentration App
Another consideration is portfolio concentration. Our Concentration App compares the concentration of any two ETFs across different metrics. Are you looking for a fund that leans heavily on a specific theme? Or are you after a broader, diversified approach? Either way, this tool will show you just how concentrated your fund is, so you can choose the right fit for your time horizon and investment goals.

Step 5: Provider Classification
Lastly, it’s worth looking into the fund provider itself. Our Classification Tool lets you check out the fund issuer’s footprint, expertise, and even closure risk. Knowing whether your provider is an established player, or a niche specialist can help reassure clients about the fund’s credibility.
Capital Group, for example, has over $40 billion in U.S.-listed ETF assets, spread across 21 funds, which speaks volumes about their reliability as a provider.

Trends and Investor Preferences
Trackinsight’s Global ETF Survey 2024 paints a clear picture of the strong demand for active and thematic ETFs. Among the 500+ investors surveyed, who oversee around $900 billion in ETF assets, a whopping 73% are already invested in or show a strong interest in active ETFs. Even more striking is that more than 80% of investors prefer active strategies in an ETF wrapper rather than a mutual fund, and a solid 81% would consider converting existing mutual fund holdings to ETF format if offered a tax-free exchange.
Here’s the bottom line: Active ETFs are growing like wildfire. Yes, due diligence can be challenging, but it doesn’t have to be overwhelming. With the right tools at your fingertips, finding a quality active ETF has never been easier. And as always, don’t think alone—if you have questions, we’re here to help.
Original article here


