When it comes to index investing, the word on everyone’s mind is diversification. The concept is simple enough: spread your assets across different baskets so that if one drops, the rest don’t fall with it. But in the ETF world, diversification takes on unique dimensions. It’s not always a black-and-white “spread your risk” approach; instead, it can sometimes be a carefully crafted strategy to control volatility, enhance returns, or tap into specific areas of the market.
But while diversification offers stability, concentration offers the potential for much higher returns, albeit at the cost of increased volatility. Let’s dive into how these two concepts play out in the ETF landscape.
The Value of Diversification
Diversification’s main goal is to reduce volatility by spreading risk across multiple asset classes, creating a balanced mix where gains in one area can offset losses in another. This approach is often associated with buy-and-hold strategies focused on long-term stability. Think of it like “not putting all your eggs in one basket”—if one basket breaks, the rest stay intact. For investors, diversified ETFs provide a bumper against sudden drops in any single sector or stock, promoting smoother, steadier returns. However, diversification also has its drawbacks: when markets are soaring, a diversified portfolio may miss out on the full upside potential compared to more focused investments.
The Flip Side: Concentration
Concentration, on the other hand, goes all-in on a specific sector or stock, offering the potential for substantial gains if that focus area performs well. Concentrated ETFs can deliver market-beating returns but come with higher risk and volatility. These ETFs are suited to investors with high conviction or those seeking targeted exposure, even if it means riding out rough patches. With recent growth in concentrated ETFs like single-stock, leveraged, and inverse funds, investors now have more tools for taking precise, sometimes speculative, positions. However, the full upside of concentration comes with a warning—be prepared for a roller-coaster ride that isn’t for everyone.
Diversification and Concentration in Regulatory Terms
Diversification in ETFs isn’t just about how many stocks are in a fund; it’s about the concentration lurking within that basket of holdings.
Registered Investment Companies (RICs), like most ETFs, follow IRS diversification rules that allow them to pass profits to investors without paying corporate taxes. These rules keep any one stock from taking up too much of the portfolio, which is great for tax efficiency and limiting risk. But “diversified” in the regulatory sense doesn’t always mean “diverse” in reality, especially in big, market-cap weighted index funds like the S&P 500.
Even though the S&P holds 500 companies, a few mega-cap stocks, tech giants, usually end up dominating because of their size. This creates a “hidden concentration” where a handful of companies steer the ship, making the ETF much more volatile if those few stocks take a hit.
Now, compare that to an equal-weight ETF that spreads the allocation evenly across all holdings. These might look the same on paper, but in practice, they’re night-and-day different: equal-weighted funds don’t get bossed around by any one stock and can give a purer “diversification” effect. It’s the difference between putting money in a crowd vs. just backing the big guys.
Bottom line? Don’t let the label fool you; real diversification is more than a box checked by the SEC.
Measuring Diversification & Concentration
So, how do we measure diversification and concentration within an ETF? Here’s where things get technical. Traditionally, the Herfindahl-Hirschman Index (HHI) has been a metric used in anti-trust regulation to assess market concentration.
At Tidal, we’ve taken the HHI concept and applied it to ETF analysis, creating Tidal Diversification Calculator that ranks concentration levels. The formula is as follows:


In simple terms, this calculation provides a score that allows investors to compare ETFs based on their diversification level, where lower scores indicate greater diversification.
Here’s a head-to-head of two S&P 500 giants: SPDR S&P 500 ETF Trust (SPY) and Invesco S&P 500 Equal Weight ETF (RSP). Across nearly every category, SPY shows higher concentration, though the gap narrows in market cap concentration and in sector concentration.
Based upon this example, the formula gives the nod to RSP as a more diversified pick over SPY.
The goal with the Tidal Diversification Calculator here is transparency: by using a standard metric, investors can better understand how diversified or concentrated a particular ETF is, helping them make more informed choices.
A Framework for Understanding: The ETF Management Matrix
To further break down the ETF landscape, the ETF Management Matrix was introduced in partnership with ETF Research Center. This tool adds another layer by categorizing ETFs based on their management style and diversification level. Picture the matrix as a grid, with the X-axis representing the type of ETF—active, non-traditional/rules-based, and passive—and the Y-axis showing the ETF’s diversification level according to our Tidal Diversification Formula.
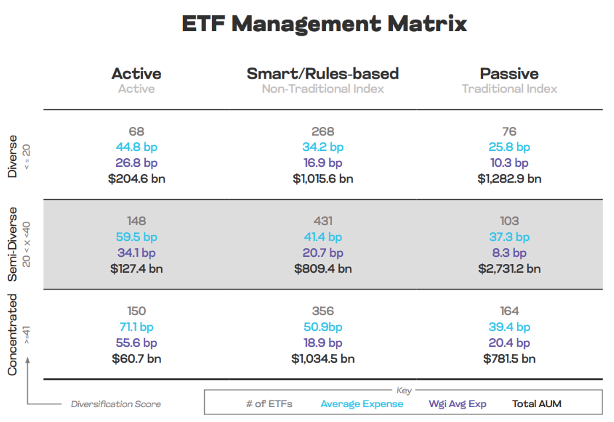
This matrix provides a visual snapshot, helping investors quickly grasp the diversity of options in the ETF universe and identify which funds match their diversification and management preferences. 366
When examining the matrix, the AD category is the rarest breed in the ETF world, with just 68 out of 1,769 non-leveraged equity ETFs making the cut. That’s a mere 3.8% of all equity ETFs and about 18.5% of active equity.
What does stand out is the average expense ratio and total AUM. AD’s average expense ratio is less than half of the concentrated active ETFs. And when it comes to total AUM, AD is pulling in more assets than both concentrated and semi-diverse categories combined.
Now, let’s explore the AD ETFs with the most assets.
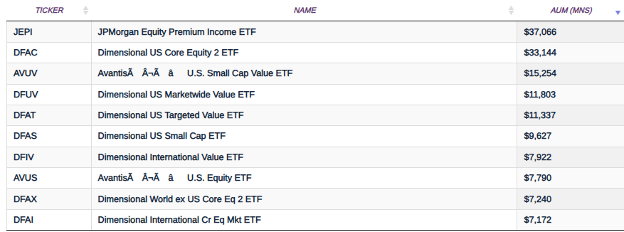
The AD category is dominated by assets from Dimensional and Avantis. Dimensional, in particular, racked up serious AUM through mutual fund-to-ETF conversions, a move designed to give investors a better after-tax return in the more efficient ETF wrapper.
While technically labeled “active,” these ETFs look and feel more like low-tracking-error, style-box strategies.
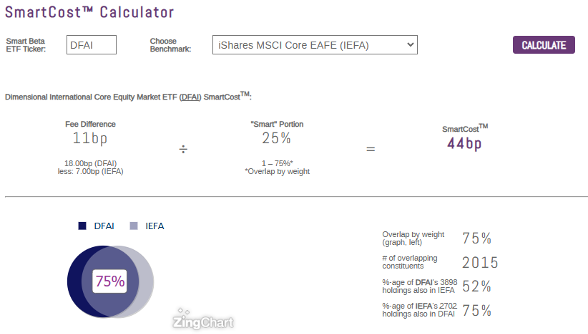
Our Tidal Smart Cost Calculator shows that DFAI’s 3,898 holdings match up with 52% of the securities in the iShares MSCI Core EAFE ETF (IEFA). Adjusting the weights pushes that overlap to a hefty 75%.
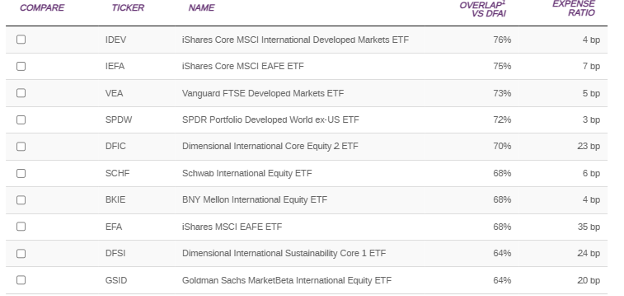
Now, when you look at the 10 closest ETF competitors, 60% of them are passive, which tells you something: the main audience for these AD ETFs is likely traditional style-box mutual fund investors making the jump to ETFs to tap into the structure’s tax and cost benefits.
The Bottom Line
Ultimately, the choice between diversification and concentration boils down to individual goals, risk tolerance, and market outlook. With tools like the Tidal Diversification Calculator and the ETF Management Matrix, investors now have better ways to measure and compare ETFs, giving them the insight they need to balance risk and reward effectively.
Whether spreading your eggs across baskets or stacking them in one, the ETF landscape offers options for every investor’s appetite.