ETF issuers are shattering records.
According to the Tidal ETF Industry KPI Report March 3, 2025, issuers are raking in an estimated $17.4 billion in expense ratio revenue over the past year, a testament to the explosive growth in rising AUM and the boom in Active and Derivative ETFs.
Unlike passive index-tracking funds, active ETFs rely on professional management to adjust holdings based on market trends.
This active oversight often comes with higher fees, a key driver behind the record-breaking revenue figures.
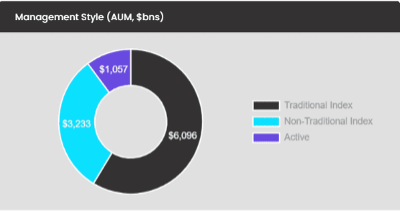
As of March 2025, actively managed ETFs account for $1.05 trillion in AUM, with 79% of all new ETF launches in 2024 being actively managed.
The appeal of active ETFs lies in their potential to:
- Generate enhanced income through options-based strategies like covered calls.
- Provide tactical exposure to market trends, such as AI or nuclear energy.
- Offer hedge fund-like management with more liquidity and transparency than mutual funds.
With issuers capitalizing on these advantages, active ETF expense ratios remain significantly higher than their passive counterparts, translating into greater fee-based revenue for the industry.
ETF issuers maximize revenue through two key approaches: scale and pricing power.
While low-cost giants like the Vanguard S&P 500 ETF (VOO) dominate AUM, funds like the ProShares UltraPro QQQ ETF (TQQQ) and the JPMorgan Equity Premium ETF (JEPI) generate significantly more revenue per invested dollar by charging higher expense ratios.
With $587 billion in AUM, VOO dominates the market, leveraging its ultra-low 0.03% expense ratio to generate approximately $176 million in annual revenue, or roughly $482,466 per day.
Despite its scale, VOO earns significantly less per dollar invested compared to higher-fee ETFs.
Meanwhile, TQQQ, the largest leveraged ETF, generates approximately $164 million annually from just $19.6 billion in AUM, thanks to its 0.84% expense ratio, translating to $450,959 per day.
JEPI, the largest active ETF, produces $136 million annually from $39 billion in AUM at a 0.35% expense ratio, averaging $373,562 per day.
Despite VOO being roughly 30 times larger than TQQQ, both ETFs generate nearly the same annual revenue.
Similarly, JEPI generates nearly as much revenue as VOO, despite having just a fraction of its AUM.
This highlights how higher-cost, derivatives-based ETFs tailored for traders and income investors can be more profitable than larger passive funds.
Will ETF Fees Continue to Rise?
The ETF industry’s record-breaking revenue raises an important question: Can issuers maintain these margins, or will competition force fees lower?
Despite the surge in actively managed and leveraged ETFs, fee compression remains a looming challenge.
Issuers must continue proving their value.
Those who successfully differentiate their active strategies and provide clear advantages over passive alternatives will likely maintain their pricing power, while others may need to cut fees to stay competitive.
With over 500 new ETFs launched in 2024 and issuers continuing to innovate, the ETF revenue boom shows no signs of slowing.
However, the next phase of growth will be defined by who can balance performance, cost efficiency, and investor demand in an increasingly crowded marketplace.
All ETF Revenue estimates are based on Morningstar data as of March 28th, 2025.