Voted the Best Capital Markets Team, the Best US White Label Platform, the Best ETF Research Provider, the Best Overall ETF Administrator, the Best ETF Administrator – Equity ETFs, and the Best ETF Administrator – Fixed Income ETFs
2025
Tidal’s use and promotion of the 2025 US Awards received was undertaken in coordination with ETF Express, for which compensation was paid.
Voted Best Service Provider of the Year by ETF.com, recognized for experienced strategy development, operations support, and marketing across the ETF industry.
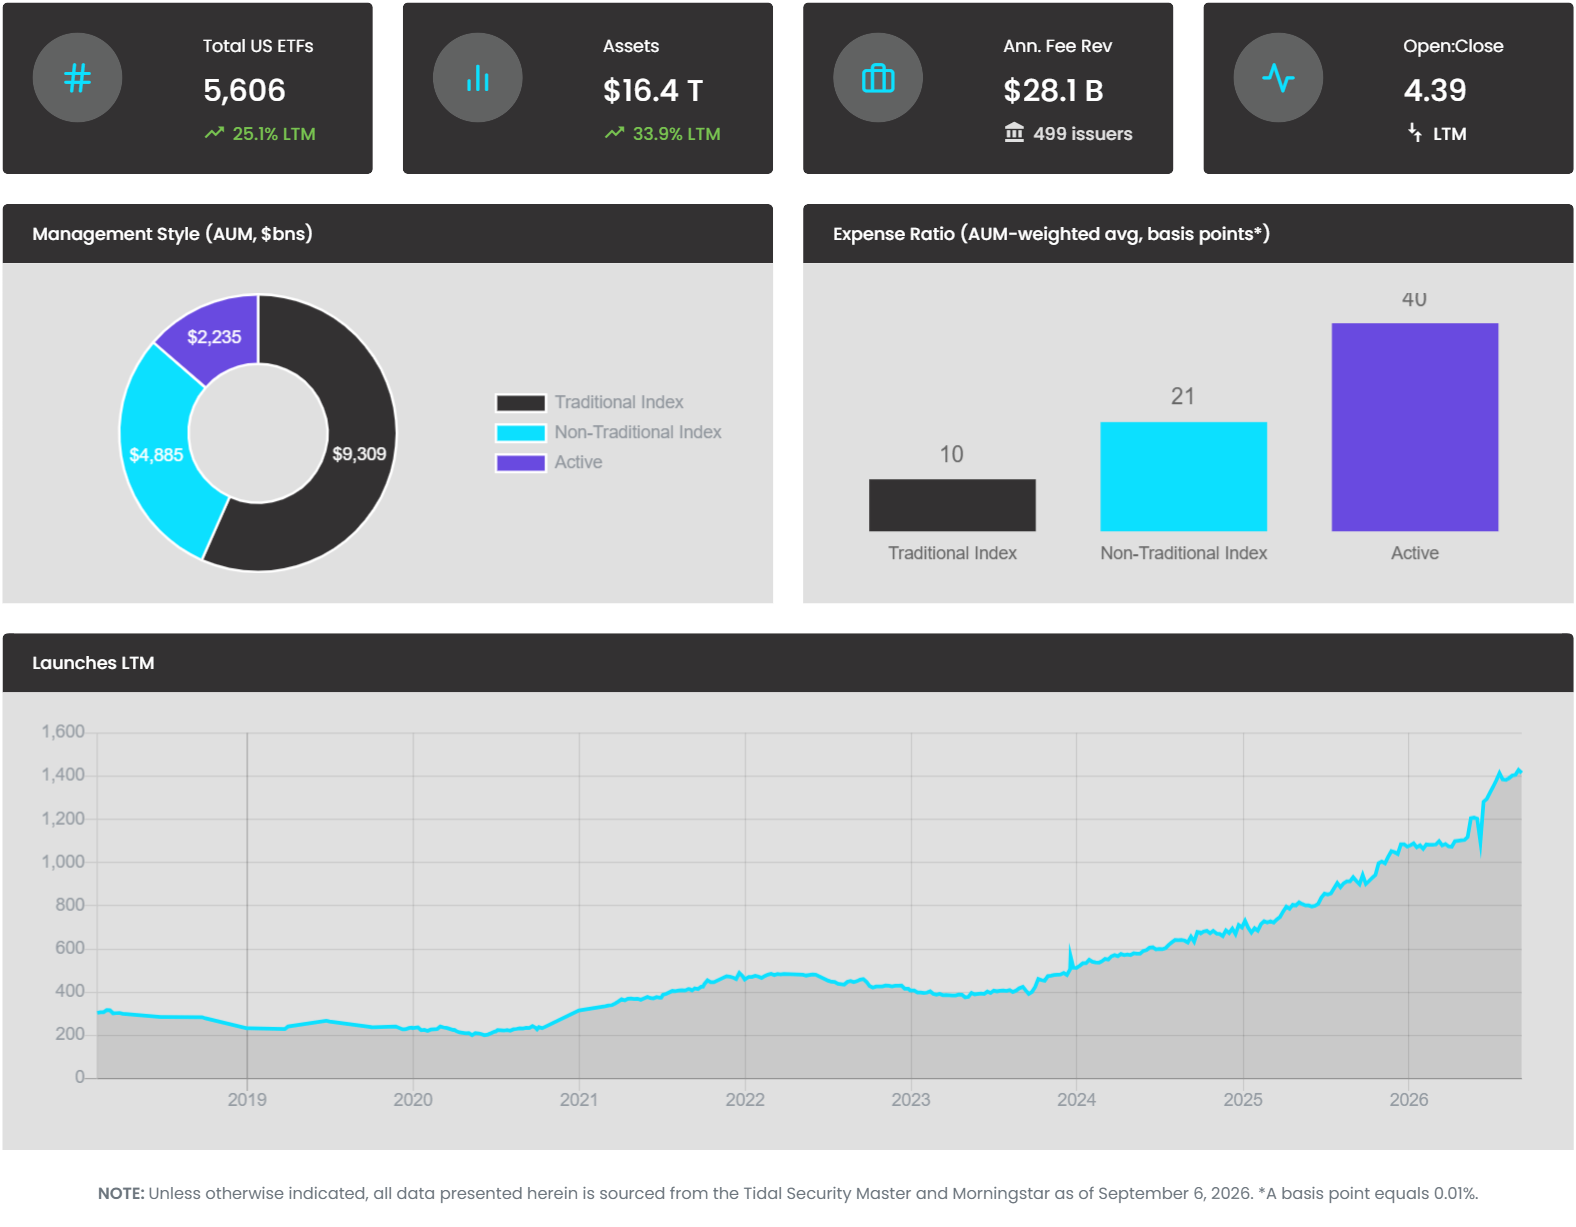
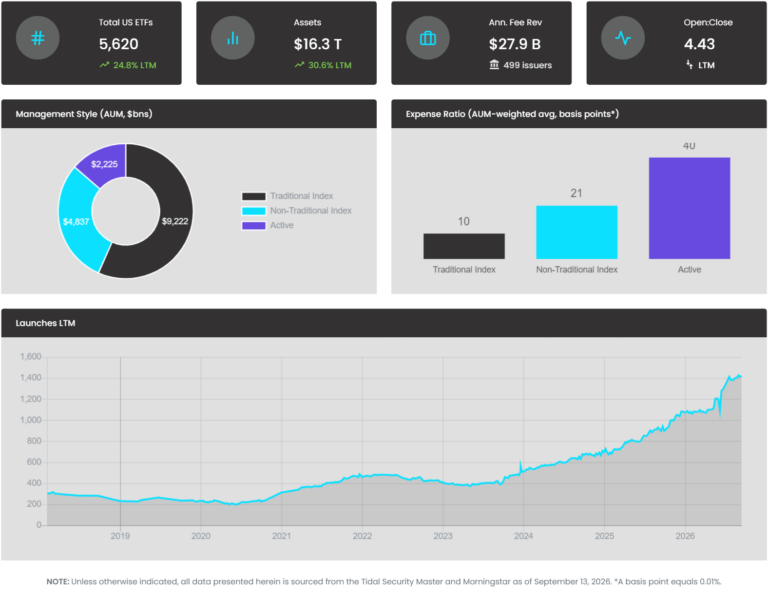
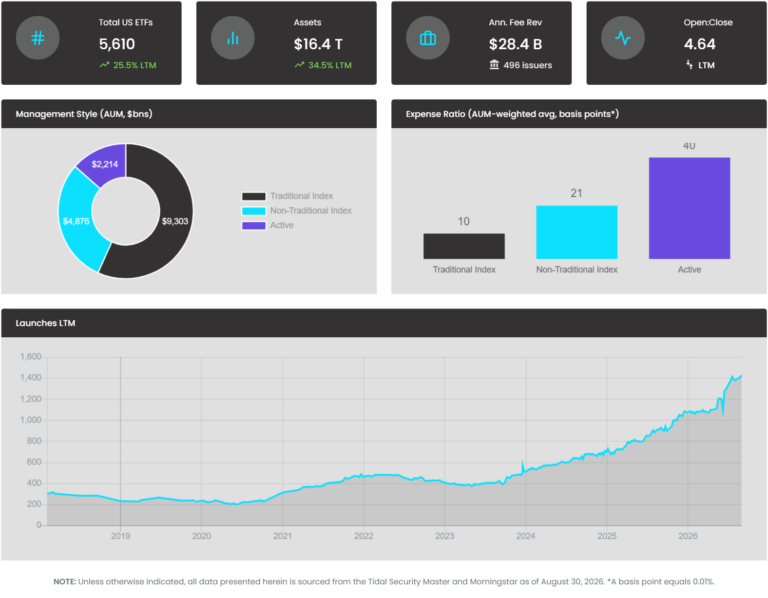
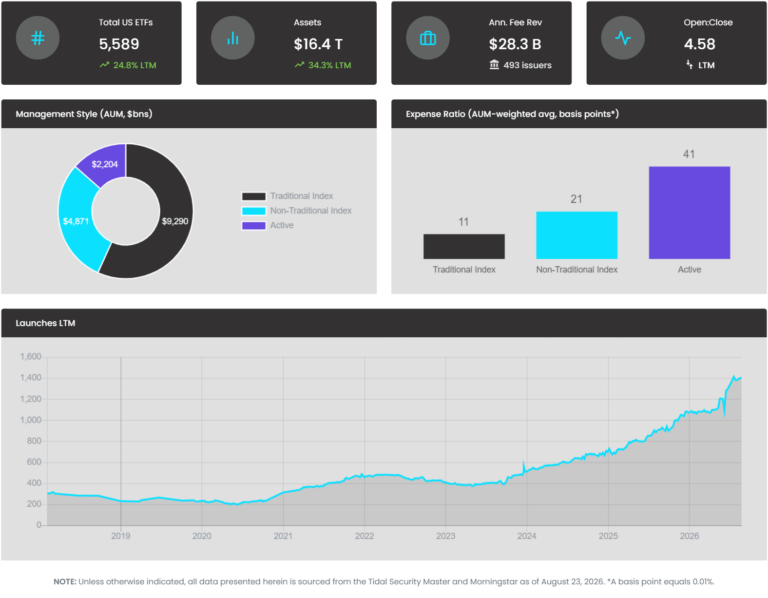
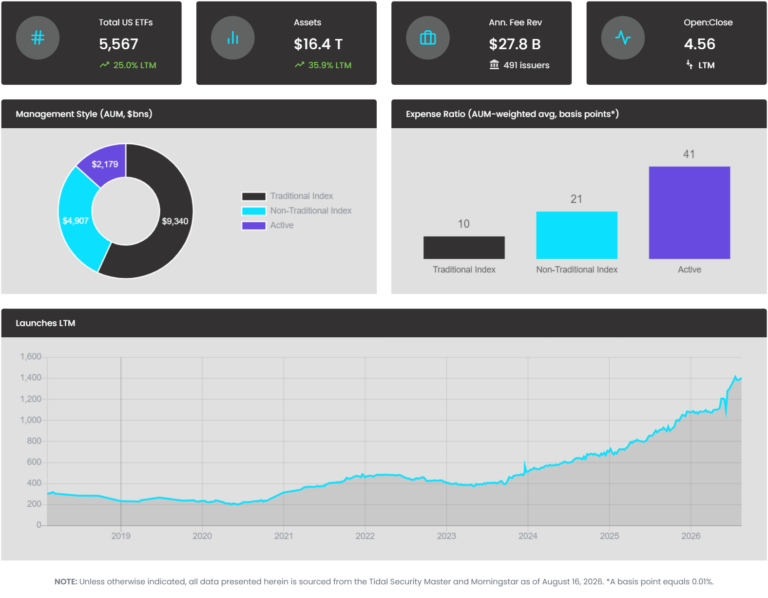
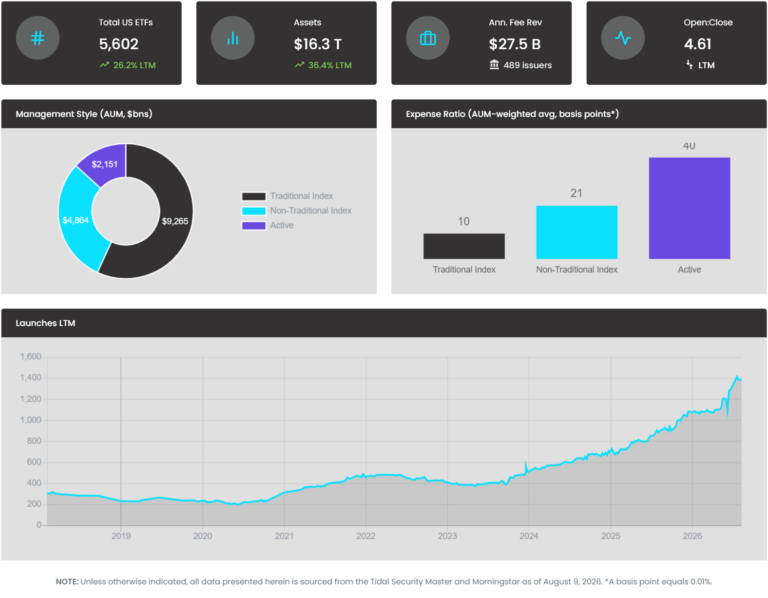
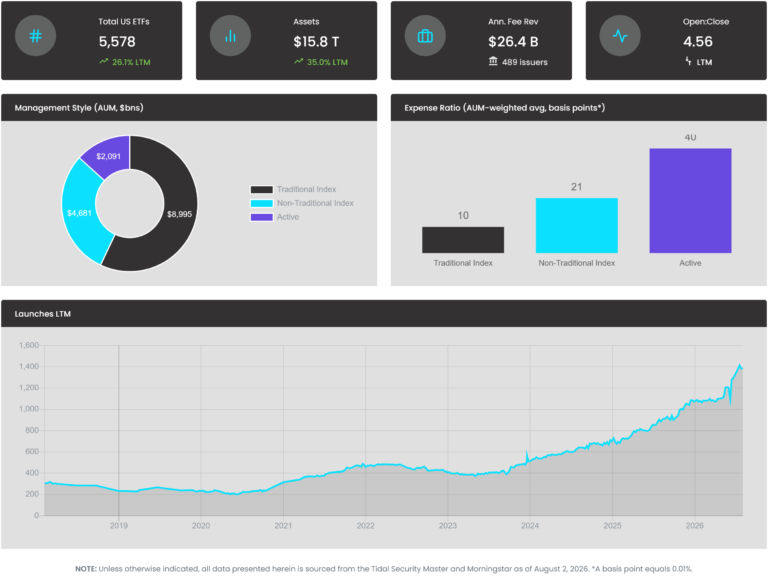
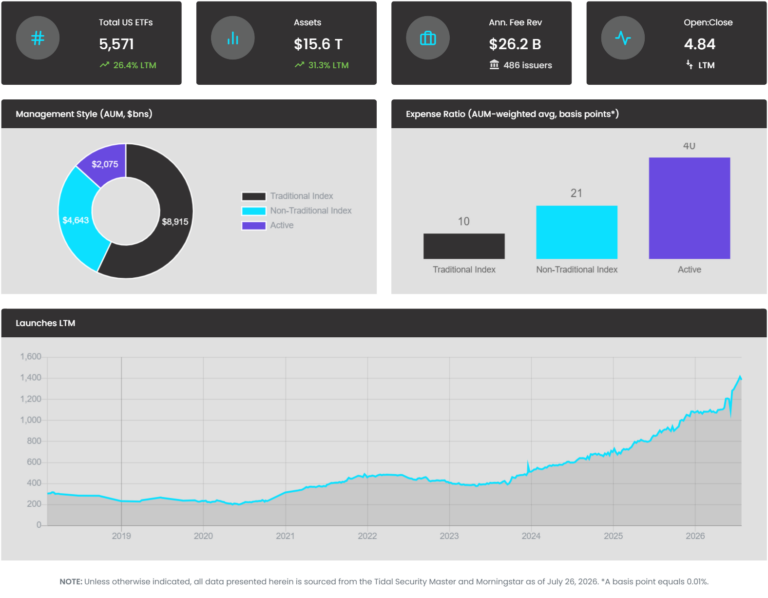
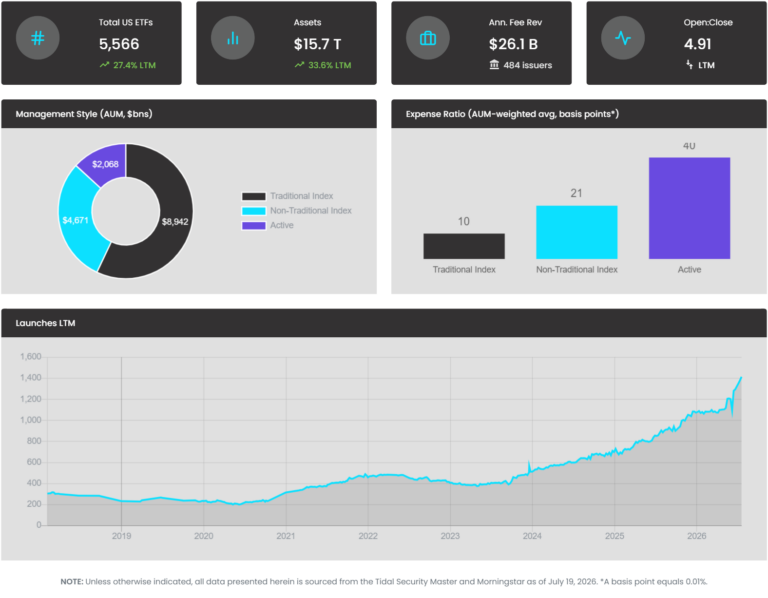
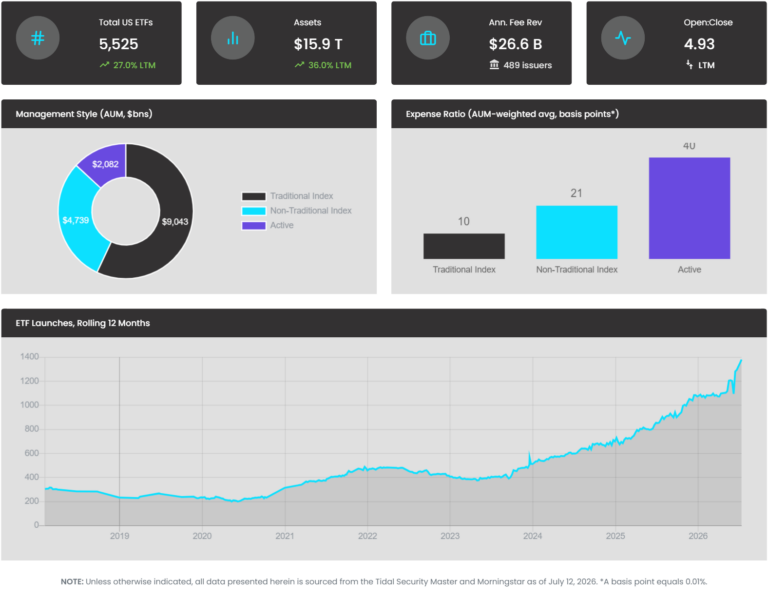
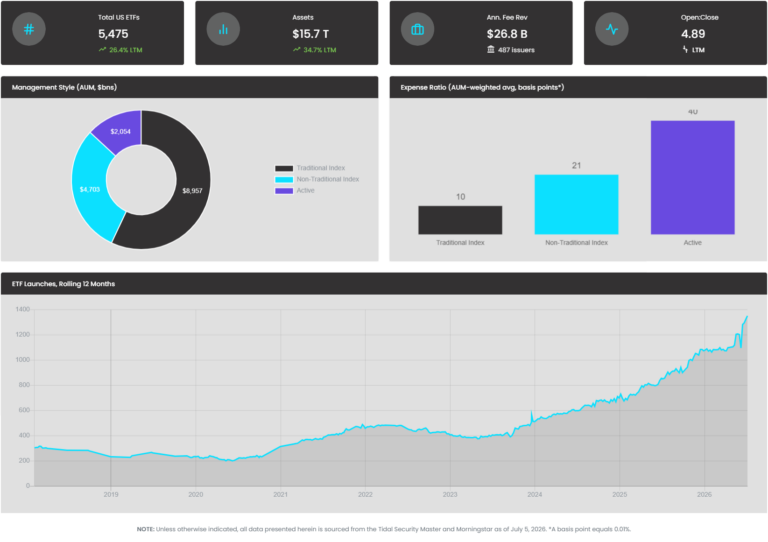
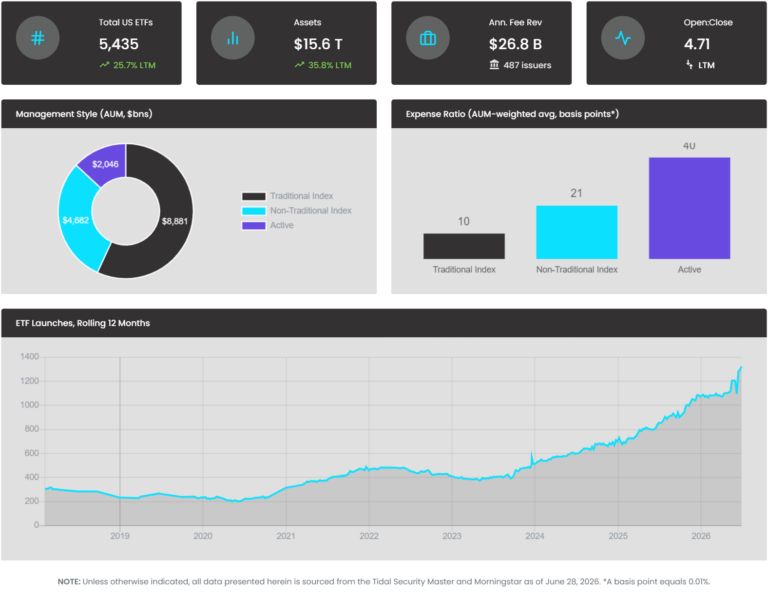
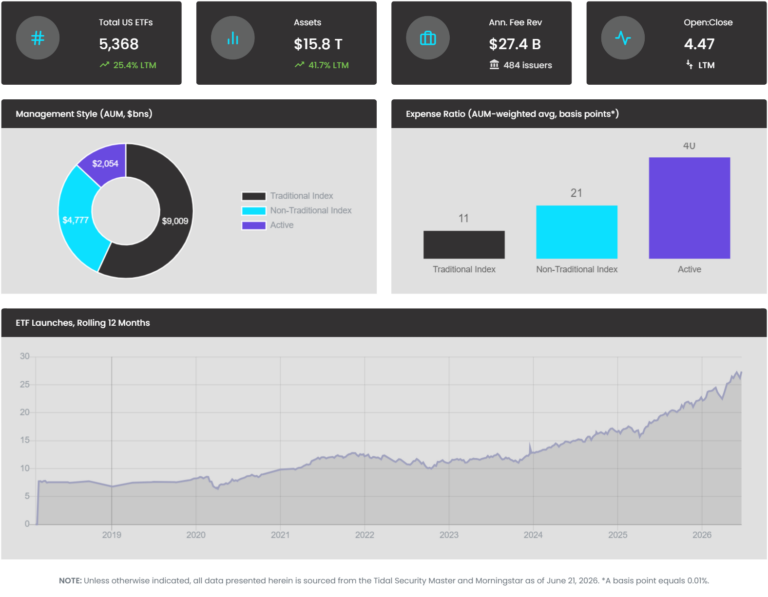
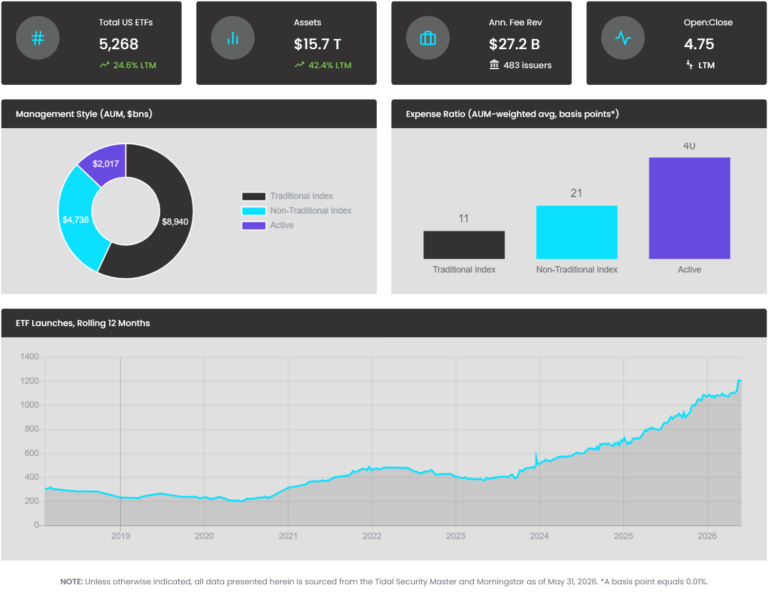
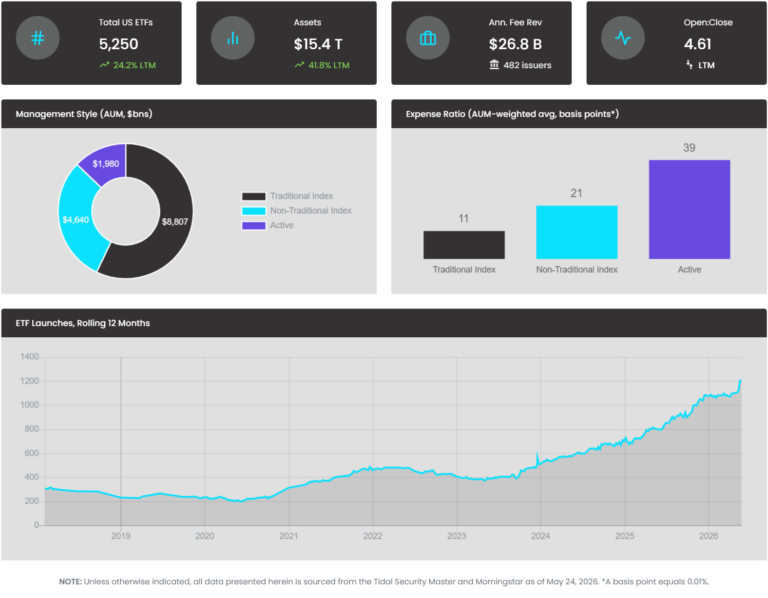
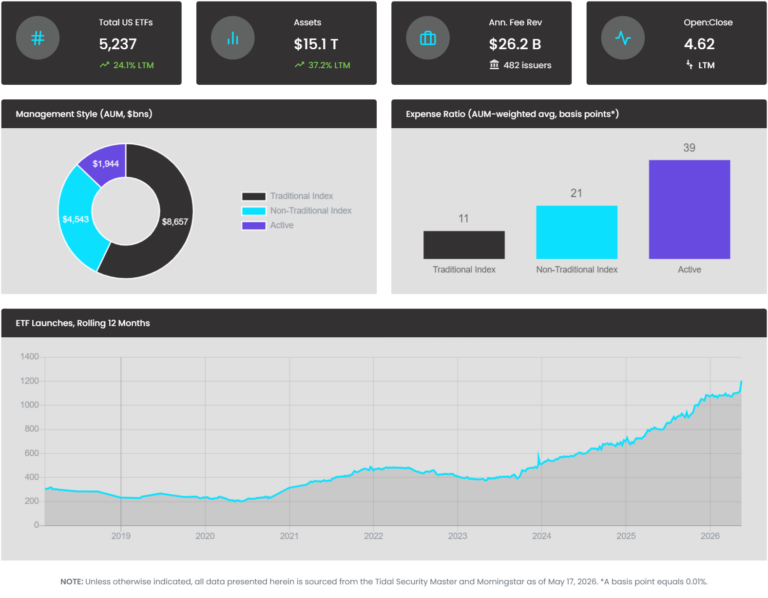
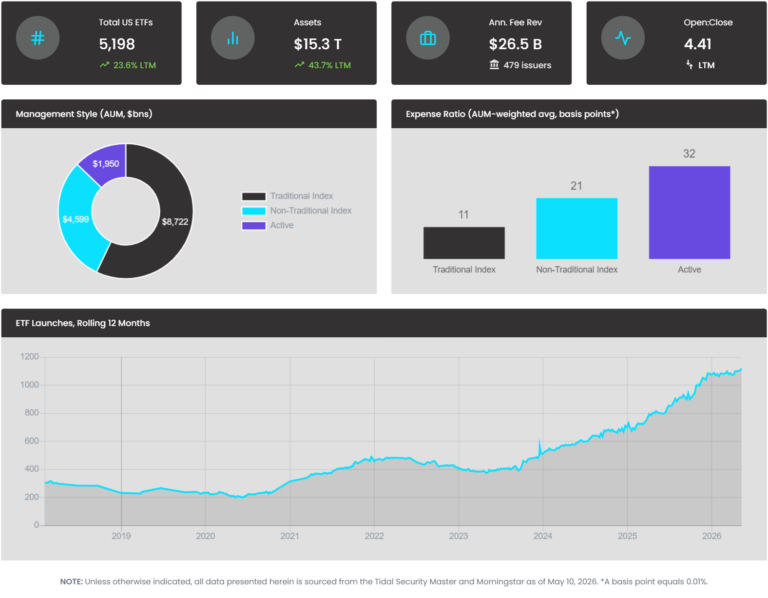
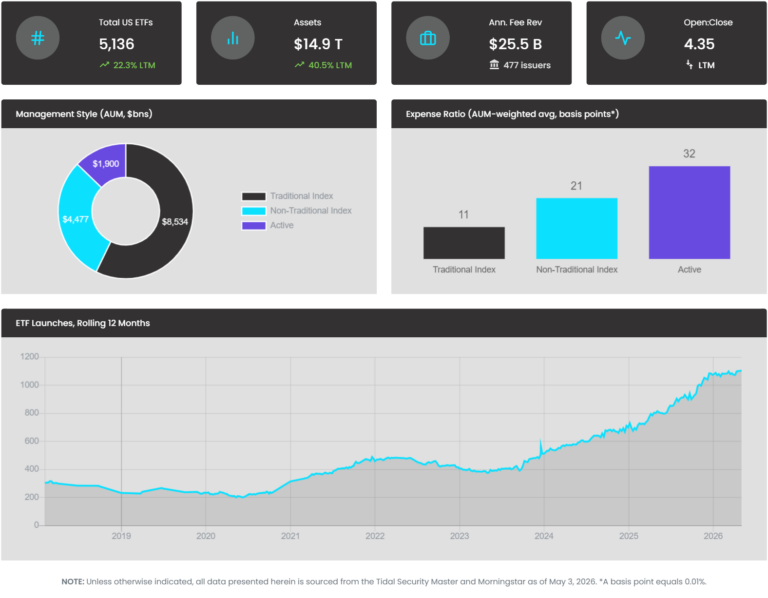
This week’s KPI data overview highlights key metrics and trends shaping the ETF landscape:
The number of U.S.-listed ETFs declined by four last week to 5,606 as we removed 15
due to delistings and added only 11 new funds.
The Open:Close ratio over the last twelve months fell to 4.39, its lowest point since
early May this year.
AUM edged up another 0.2% last week to $16.4 Trillion, +33.9% YoY.
Although traditional, passively-managed ETFs still account for about 57% of AUM,
they generate only about 32% of industry revenue from fees, and account for less
than 11% of listings
This material is for informational purposes only and does not constitute an offer to sell or a solicitation of an offer to buy any security. It should not be relied upon as investment advice, and it does not consider the investment objectives, financial situation, or particular needs of any individual investor. Investors should consult a financial professional before making any investment decisions.
Past performance is not indicative of future results, and there is no guarantee that concentrated strategies will outperform more diversified approaches. References to specific ETFs and providers are for illustrative purposes only and do not constitute an endorsement or recommendation.
The Tidal Diversification Calculator is a proprietary tool intended solely to help investors understand ETF diversification levels. It should not be construed as a recommendation to buy, sell, or hold any particular ETF. Any analysis provided (e.g., comparing SPY and RSP) is based solely on diversification metrics and does not imply suitability for any investor. Differences in returns, liquidity, expenses, and other factors should be considered before making any investment decision.
All investments involve risk, including the possible loss of principal. There is no guarantee that any investment strategy will be successful.